In the last years, it has been acknowledged that an important and significant proportion of valuable data produced by scientific institutions remains unpublished, or, worse, unmanaged. Such data aren’t visible at all, neither to the public audience—which often happened to have paid for them—, nor to the scientific community that could benefit from them.
Continue reading →Year: 2017
stabiliseR, take 2
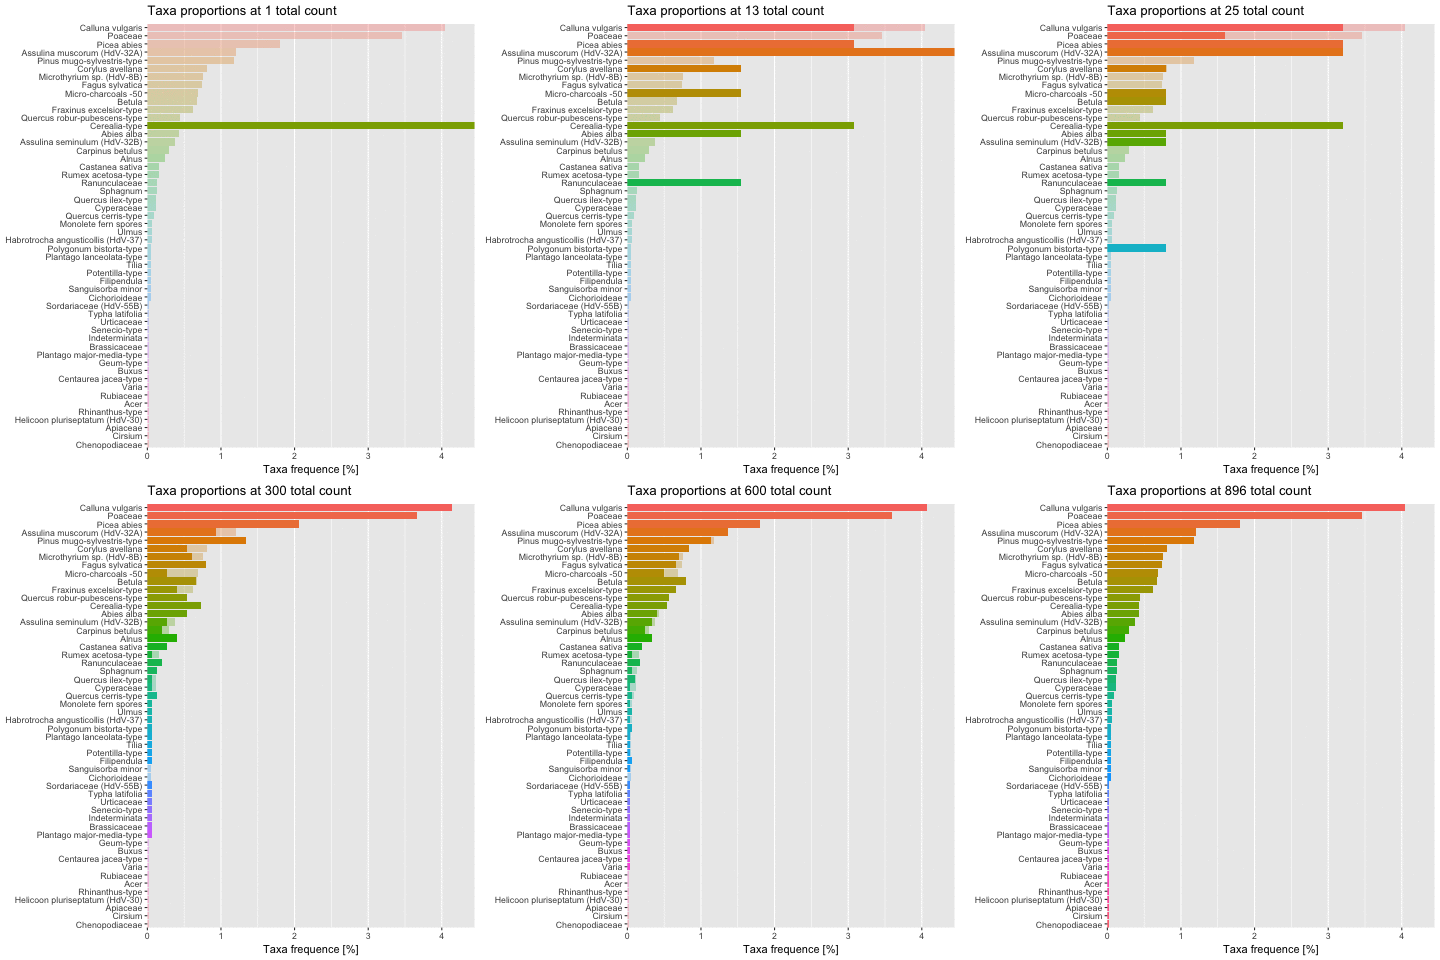
Some time ago I presented you a software to better estimate how relient palynological counting data can be, which I called stabiliseR. I’ve been working on a slightly different approach to represent the same information, and make it more appealing. I came to this animated bar chart:

As you can see, each taxa proportion gets closer to its final value as the total count increases, and variations tend to decrease. The tidyverse and ggplot approach/magic made it very easy to impletement. You first need the gganimate package and then to include a frame argument in your plot’s aesthetics.

This will create a normal plot, ignoring the frame argument. But the gganimate() function can actually understand what it means:

This will create a GIF in your working directory with as many different frames as values in the variable_to_animate provided to the frame argument. It’s that easy!
XRF for palaeoenvironmental sciences
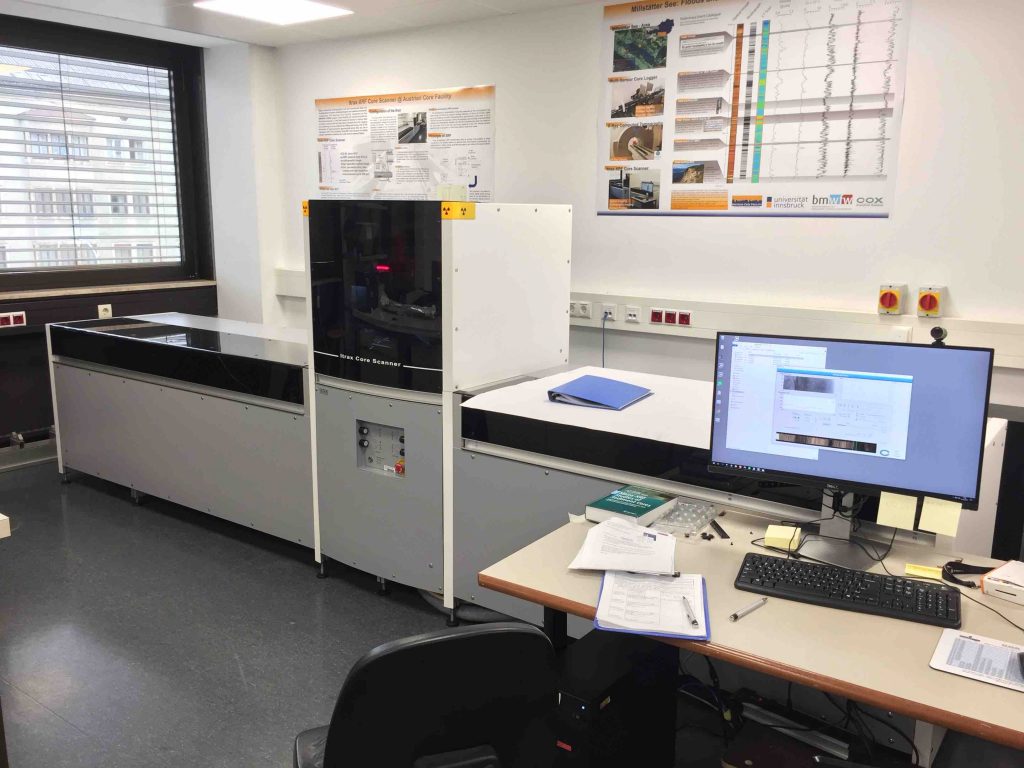
I’m back at the University of Innsbruck to go on with the palynological analyses from the Lake Mondsee, as part of the Beyond Lake Villages project. I’m currently learning how to operate an Itrax XRF Core Scanner.

Follow a project's progress
As the end of a projet is getting closer, it is often time to show synthesis of the work achieved. For every project I’m dealing with, I keep up-to-date a (simple) Excel file of the samples I collected and analysed, but I thought about a nifty graph that could get the job done in a nicer way 🙂
Continue reading →Learning Qt
One year ago, I told a friend—who happens to be an expert in computer science—I have a dream project. I would like to create my own software. After defining my needs and strategy, he advised me to look for Qt. Qt is a language (C++-based) and environment for software and user interface development.
Recently, after a couple of frustrating experiences with the current solutions, I took the time and started to learn with language, thanks to video tutorials from ProgrammingKnowledge. So far I’ve learnt how to display text on the user interface, how to add push buttons, check and radio boxes, how to interact with user using dialogs, how to create menu options, and how to arrange all that in specific layouts and multiple views. The basic for building a user interface. Now, I need to learn the data handling that a software has to do at some point.
I’ll let you know about the progress 🙂 The big question is, what is this secret software I want to build…
Identifying NPPs
Since a few decades, palynologists not only consider pollen grains and bryophytes and pteridophytes spores in palynological samples, but also any other kind of micro-fossil preserved. Such rests – called non-pollen palynomorphs – come from various origin. Most of them are fungal remains or algae, but there are also plant and animal remains, dinoflagellates, etc.
Continue reading →The new Ben’s coat has been delivered!
WordPress had powered this website from the beginning. There are so many things a blogger can do with WordPress. This is certainly the most popular platform for blogging. However it was probably too much in comparison to what I really needed. Very recently www.benscoat.eu has moved to a new structure, much lighter, with just enough customisation options. This is what you’re seeing at the moment.
Continue reading →Palaeo-ecology sessions at next EPPC
From August, 12th to August, 17th 2018 will take place the place the next EPPC (European Palaeobotany and Palynology Conference) in Dublin, Ireland. I’ll be co-organising two sessions on palaeo-ecology.
Continue reading →