As the end of a projet is getting closer, it is often time to show synthesis of the work achieved. For every project I’m dealing with, I keep up-to-date a (simple) Excel file of the samples I collected and analysed, but I thought about a nifty graph that could get the job done in a nicer way 🙂
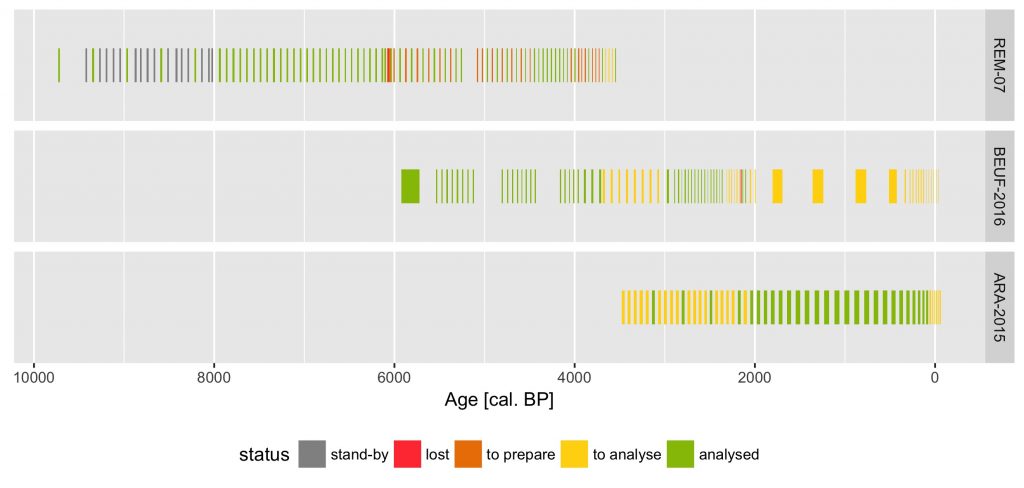
The nice thing about this graph is that one can see at a glance the current and expected time resolution of the analyses. With a status assigned to each sample in the Excel file, and an age-depth model, it only takes a few lines of code to get that! I’m seriously thinking in using it as a routine check to track my projects’ progress.