Software

Open New LibreOffice Documents Easily

Open New LibreOffice Documents Easily

After the most successful poll in Twitter’s history, I switched from Office to LibreOffice more than one year ago. There were many reasons to this shift, the main one being my non-willingness to pay a licence for software that I use less and less. For instance, Excel is only a UI to have a glance at data, since I analyse and produce graphics and summaries from them exclusively with R; and I use Word and PowerPoint only for compatibility with my colleagues, since I use LaTeX, Markdown, or R to produce text documents and presentations.

However, on macOS, LibreOffice is not a bundle of several apps (Writer, Calc, Impress), but a single application that contains the modules necessary for all these features. The application dynamically shows on the UI only the relevant modules (eg only the ones for a text document, for a spreadsheet, or for a presentation). I’m fine with that, except that there is no shortcut to open any given type of document. If you’re running a text-focused UI, the shortcut to open a new document opens a new text document. If you’re running a spreadsheet-focused UI, the same shortcut opens a new spreadsheet. Etc. But I found a solution.

Continue reading →
Posted by Benjamin in Software, 0 comments

How to reconcile clam and rbacon input files

As palaeoecologist, I work on data retrieved from natural archives, going back in time. It can be a lake sediment core or peat. The time scale of the data, actually, is built by interpolation of a few radiocarbon dates, measured at particular places along the core. This creates an age-depth model. I routinely use two R packages from Maarten Blaauw to do this:

  • clam, for classical age-modelling,
  • and rbacon, for Bayesian accumulation (and it’s an R package, obviously).

Each package defines its own function (clam() and Bacon(), respectively) which only needs the name of the core, to find a CSV file on your computer with the same name. This is in this CSV file that one saves the results of the radiocarbon datings to use them with either clam or rbacon. However, each package expects the data to be presented in a slightly different fashion. But in a file having the same name. Computers don’t allow that. And sometimes, I want to be able to use either clam or rbacon.

Continue reading →
Posted by Benjamin in Lab Notes, Software, 0 comments

Quality Control of Pollen Data at a Glance

I am currently augmenting the pollen data from two sites I studied during my PhD research, thanks to a grant from the Swiss Foundation for Alpine Studies. The one I’m dealing with at the moment is a small peat bog at a locality called Saglias, near the village of Ardez in the Grisons, Switzerland.

I usually seek for high quality and reliability of palynological data. Depending on the context, I try to identify about 1000 pollen grains per sample, or 500 tree pollen grains, and look at the taxa accumulation curve. These two indices are easily accessible in real-time counting thanks to PolyCounter, the software I’m using.

Now, some samples clearly want to drive analysts crazy. Most often they contain very few pollen grains. A typical reason for this is a poor pollen preservation. It can be useful to have a closer look at them and see if there is something one can do to improve the situation. I’m doing this by looking at a few other parameters. Again, PolyCounter is your best friend. That’s easy to import the count data and metadata (such as the number of marker spiked added) into R and compute variables to address key questions:

Continue reading →
Posted by Benjamin in Lab Notes, Software, 0 comments

How to produce a stacked plot of radiocarbon date density probabilities

Since introduced by the middle of 20th century, radiocarbon dating has been used in a large variety of disciplines. In palaeoecology, it has allowed for a major improvement in dating past phenomena. The ground principle is fairly simple: the isotope 14 of carbon (14C) is radioactive and decays following one criterion, namely the half-life. The half-life means the time necessary for the original quantity to reduce to half. For 14C, it is about 5730 years!

Living organisms, just like you, accumulate carbon in their tissues all life long. This includes a certain proportion of radioactive carbon as well, but don’t be afraid, you don’t bare any risk 🙂 This proportion is kept similar to the atmospheric level of radioactive carbon, but by the death of an organism, it is not renewed anymore and starts to decay. Half of it, every 5730 years. Therefore, if you can measure how much of radiocarbon is left in a sample today and how much of non-radioactive carbon it contains, you can use its half-life, do the reverse maths and deduce the date of this (sad) event.

Continue reading →
Posted by Benjamin in Lab Notes, Software, 0 comments

LaTeX, then pandoc

I write manuscripts with LaTeX. Yes, it might old-fashioned, compared to Markdown—which I also use—but it fits my needs. I appreciate its handling of references (I mean, from the literature), and of the cross-references. Figure 1 always means figure 1! Unfortunately, I am a bit of an outlier in my discipline, biology, to keep it general. All my colleagues I’m supposed to write manuscripts with rely and the good old Word.

Continue reading →
Posted by Benjamin in Software, 0 comments

Fast and lazy replacement in Excel

During every-day data wrangling, I often have to find and replace elements in Excel. This particularly happens when I open CSV and text files generated with R. Because French locales (and many others) use a comma as a decimal mark, Excel doesn’t recognise it in such files on my French-set system, and considers these values as text. Unfortunately, this prevents me from making quick checks with formulas…

Continue reading →
Posted by Benjamin in Software, 0 comments

stabiliseR, take 2

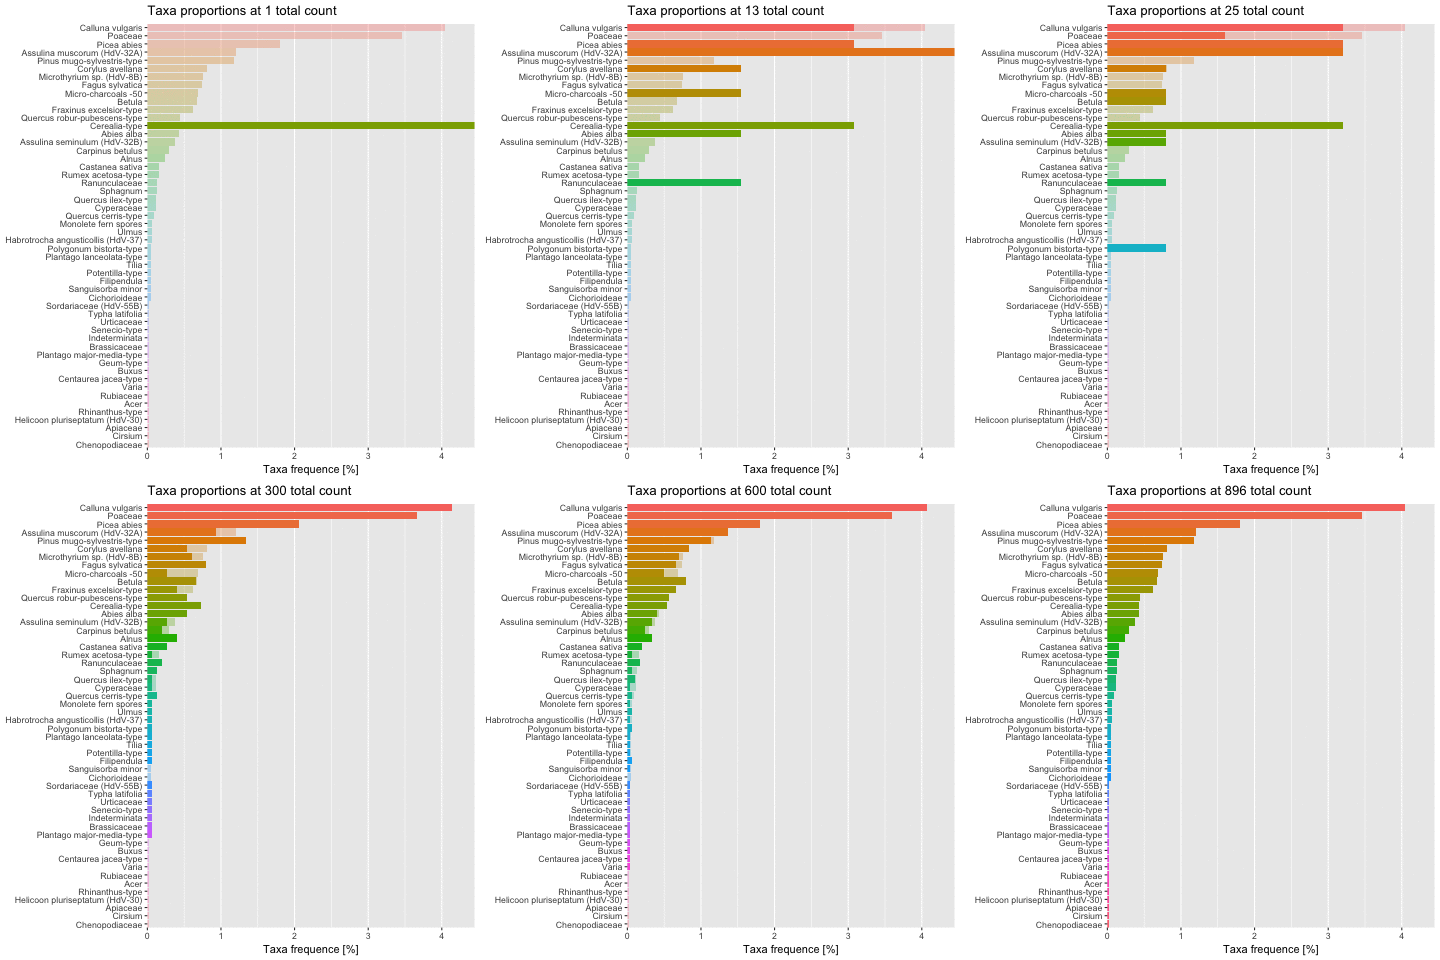
Some time ago I presented you a software to better estimate how relient palynological counting data can be, which I called stabiliseR. I’ve been working on a slightly different approach to represent the same information, and make it more appealing. I came to this animated bar chart:

As you can see, each taxa proportion gets closer to its final value as the total count increases, and variations tend to decrease. The tidyverse and ggplot approach/magic made it very easy to impletement. You first need the gganimate package and then to include a frame argument in your plot’s aesthetics.

This will create a normal plot, ignoring the frame argument. But the gganimate() function can actually understand what it means:

This will create a GIF in your working directory with as many different frames as values in the variable_to_animate provided to the frame argument. It’s that easy!

Posted by Benjamin in Software, 0 comments

Follow a project's progress

As the end of a projet is getting closer, it is often time to show synthesis of the work achieved. For every project I’m dealing with, I keep up-to-date a (simple) Excel file of the samples I collected and analysed, but I thought about a nifty graph that could get the job done in a nicer way 🙂

Continue reading →
Posted by Benjamin in Software, 0 comments