Science can be everywhere. Scientific questions, and, hopefully, scientific answers. Regularly at the university’s cantine, the salad bar offers nice options, but – in my opinion – ruins them with raisins. When I shared this taste of mine with my colleagues, only a few people answered that they like them. We therefore questioned the abundance of raisins. It started as a joke, but as practical scientists, we now want evidence.
Continue reading →Benjamin
Fast and lazy replacement in Excel
During every-day data wrangling, I often have to find and replace elements in Excel. This particularly happens when I open CSV and text files generated with R. Because French locales (and many others) use a comma as a decimal mark, Excel doesn’t recognise it in such files on my French-set system, and considers these values as text. Unfortunately, this prevents me from making quick checks with formulas…
Continue reading →What pollen people do?
Scientists definitely are multi-talented people. While we’re required to practice critical thinking on both our own and colleagues works, we also have to master many other skills. Apart from the acquisition of data, we need to properly store a numerical version of them, eventually to compute statistics on them. We need knowledge of graphical processing software to represent our results nicely, and write valuable scientific papers out of them. We sometime teach to students, that requires synthesis, pedagogic, and oral capabilities. We have to deal with paper work, which sadly tends to increase. We need to write applications for positions and/or for grants (and, ironically, so that we can do our job – are you going to the office and think “let’s first find the money to do my job”? – ). The list is endless, and there is no doubt I forgot important examples. Icing on the cake, we’re in an arena of competition, struggling for visibility and high impact factor (I should write about this guy, one day).
Continue reading →About one of the rarest pollen
Few days ago, I found a strange pollen grain that I couldn’t identify. All candidates I had in mind did not perfectly match what I could see at the microscope. Is it a strange Fabaceae, a strange Gentianaceae, a strange Helianthemum? No idea. Even with the rescue of my colleagues Burgi and Daniela, we couldn’t come to a convincing decision.
Continue reading →New year, new site
It’s been a month I haven’t posted anything here. Christmas and New Year holidays got me. Then the website has been under maintenance for a couple of days. Ironically, I’m currently enjoying all Star Wars movies (of course, in the right order). https://giphy.com/embed/ArrVyXcjSzzxe
Yoda is always a source of inspiration and motivation. So, I should not try to post here regularly, but just do it.
I’ve been busy last week performing XRF measurements. The XRF machine needs some attention every now and then, but otherwise leaves me quite some free time. I invested it in learning more what really happens behind the scene. Finally, this is another kind of these tools that I love: from a very simple mechanism, a lot is inferred. Human ingenuity really fascinates me!
I’m drafting some more posts at the moment, they’ll come in the next days 🙂
dat@osu
In the last years, it has been acknowledged that an important and significant proportion of valuable data produced by scientific institutions remains unpublished, or, worse, unmanaged. Such data aren’t visible at all, neither to the public audience—which often happened to have paid for them—, nor to the scientific community that could benefit from them.
Continue reading →stabiliseR, take 2
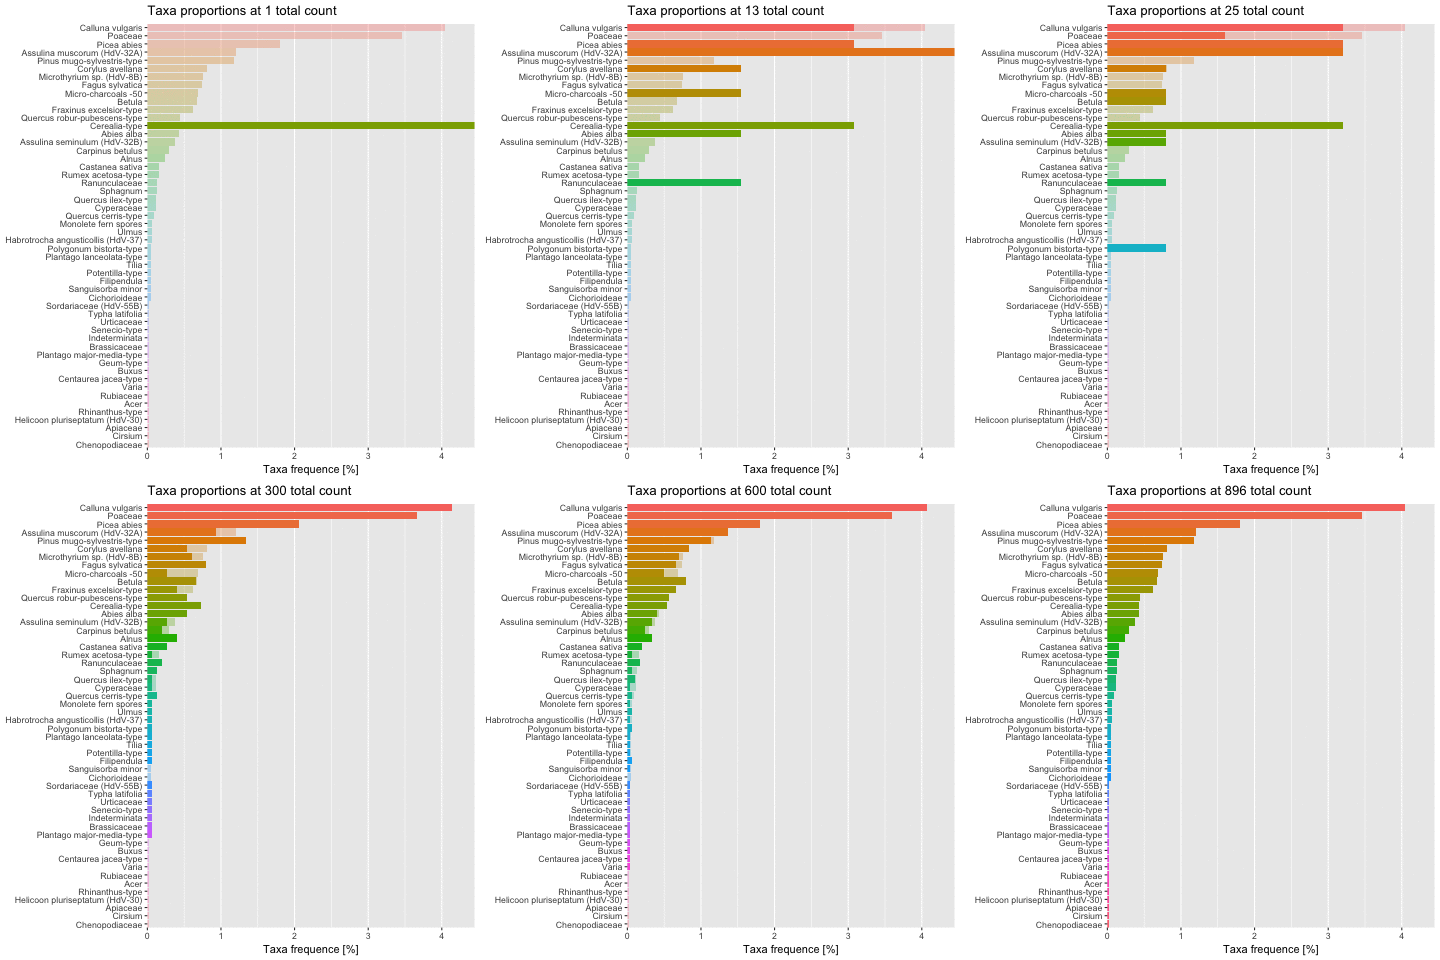
Some time ago I presented you a software to better estimate how relient palynological counting data can be, which I called stabiliseR. I’ve been working on a slightly different approach to represent the same information, and make it more appealing. I came to this animated bar chart:

As you can see, each taxa proportion gets closer to its final value as the total count increases, and variations tend to decrease. The tidyverse and ggplot approach/magic made it very easy to impletement. You first need the gganimate package and then to include a frame argument in your plot’s aesthetics.

This will create a normal plot, ignoring the frame argument. But the gganimate() function can actually understand what it means:

This will create a GIF in your working directory with as many different frames as values in the variable_to_animate provided to the frame argument. It’s that easy!
XRF for palaeoenvironmental sciences
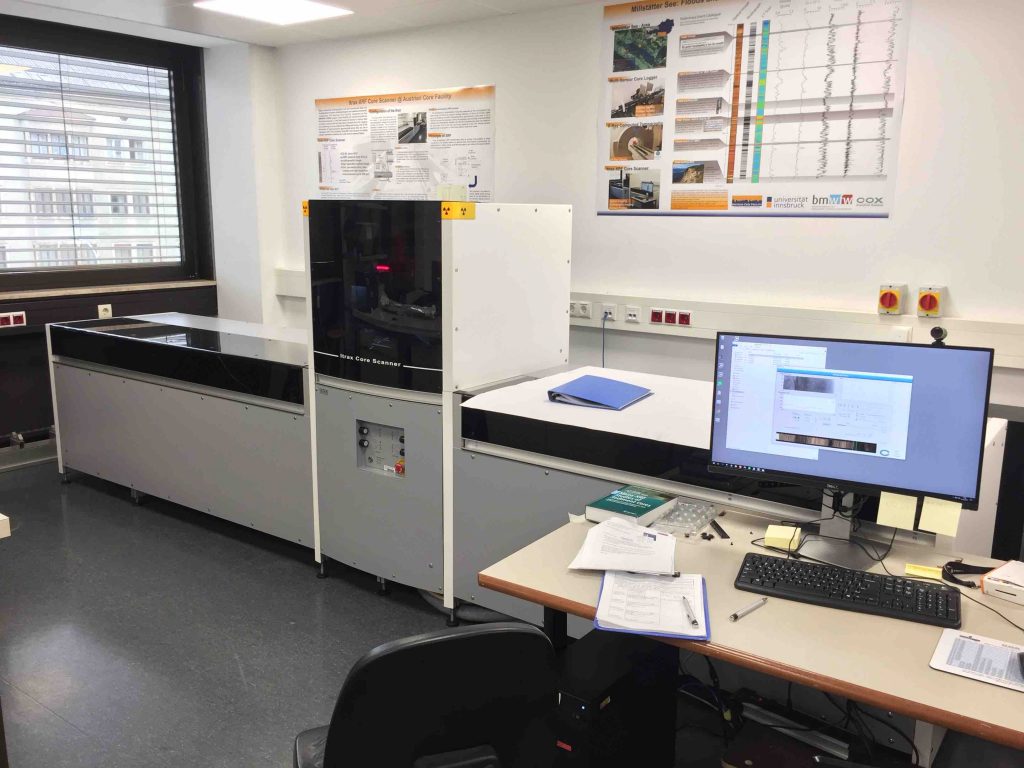
I’m back at the University of Innsbruck to go on with the palynological analyses from the Lake Mondsee, as part of the Beyond Lake Villages project. I’m currently learning how to operate an Itrax XRF Core Scanner.
